


Done Tracker app for iPhone and iPad
Developer: Stefan Preuss
First release : 20 Dec 2017
App size: 2.63 Mb
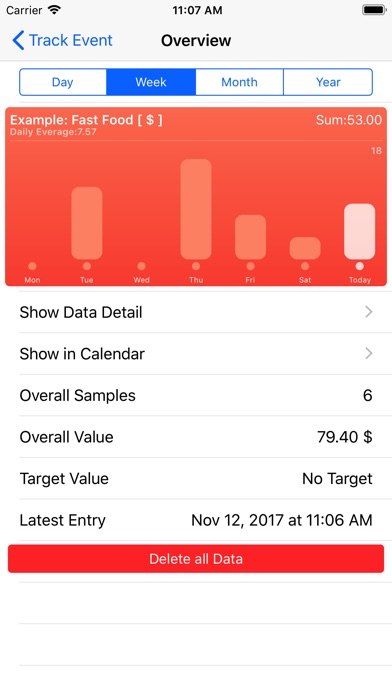
Done Tracker can track and visualize your personal habits, goals, expenses, time spent on something and much more. It simply can gather various events in life and visualize them in a time based bar-graph style or in a calendar view.
No matter if you are working on a personal goal, want to track expenses, a time period or just want to save a date, Done Tracker can do it for you.
Define a targets and goals or just use Done Tracker as an event recorder.
For example Done Tracker can track things like:
- daily coffee consumption
- expenses on fast food
- save the date like event like: been at the dentist
- weekly bicycle usage
- time tracking of working project, or workouts
- track average of school grades
- gather painkiller consumption
Events:
-------
Add as many events to your event list as you need.
Possible event types are:
- a simple counter ( increases by 1, each time you add a record )
- a numeric value ( can be a positive, negative, integer number or float number )
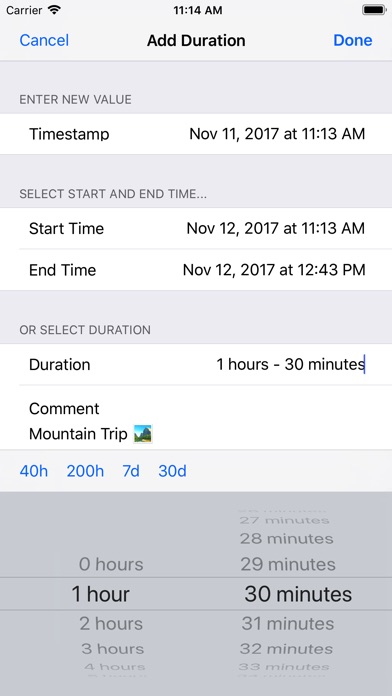
- a time span value ( like 5 hours, 15 minutes )
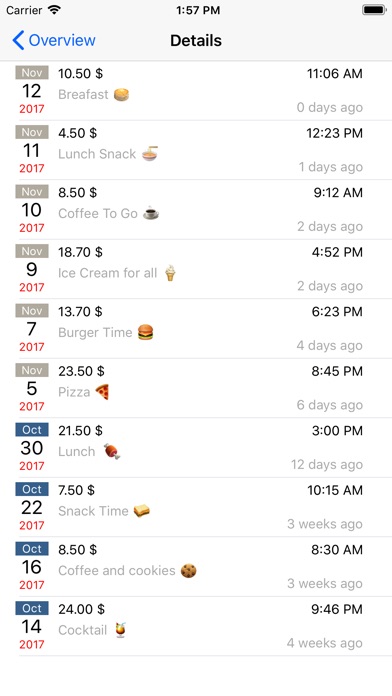
A unit can be added to each event value ( like: $, €, km, mil ). Each record can also store a comment and the current time stamp along with the value.
Sometimes it is useful to define a target value. Target values can be:
- a value to reach
- a value to keep under
In the event list a value to reach target displays the status quo in a progress view.
A value to keep under displays an icon to indicate the state:
- OK ( thumb up ) in case the value is clearly under the target
- attention ( indexing finger ) in case the value is about 80% close to the target
- fail ( thumb down ) in case the value reaches the target
Finally a time span in which the target should be reached/should be kept under needs to be set.
It can be:
- Day
- Week
- Month
- Year
- Global
Data visualization
-------------------
Display your data development over time and get an overview using the statistics.
Data can be displayed by:
- day
- week
- month
- a whole year
It is also possible to inspect your data in a Calendar like view. Or browse all your data and comments.